OSVVM Reports
OSVVM’s Reports
Good reports simplify debug and help find problems quickly. This is important as according to the 2020 Wilson Verification Survey FPGA verification engineers spend 46% of their time debugging.
OSVVM produces the following reports:
HTML Build Summary Report for human inspection that provides test completion status.
JUnit XML Build Summary Report for use with continuous integration (CI/CD) tools.
HTML Test Case Detailed report for each test case with Alert, Functional Coverage, and Scoreboard reports.
HTML based simulator transcript/log files (simulator output)
Text based test case transcript file (from TranscriptOpen)
The best way to see the reports is to look at the reports in html form. The following table provides links to a couple of them. As you examine the reports also read the text below as it highlights important aspects of the reports.
Report Description |
Link |
|---|---|
Run of OsvvmLibraries/RunAllTestsWithCoverage.pro |
|
Test Case with failures. How long does it take you to find which test cases are failing? Also note you can find the failures by looking at the HTML Simulate Transcript (log). |
|
Run of Coverage on Public and Private OSVVM Test Suites |
|
Alternately, create your own |
HTML Build Summary Report
The Build Summary Report allows us to quickly confirm if a build passed or quickly identify which test cases did not PASS.
The Build Summary Report has three distinct pieces:
Build Status
Test Suite Summary
Test Case Summary
For each Test Suite and Test Case, there is additional information, such as Functional Coverage and Disabled Alert Count.
In the sim directory, the Build Summary Report is in the file OsvvmLibraries_RunDemoTests.html. See Figure 1 Build Summary Report.
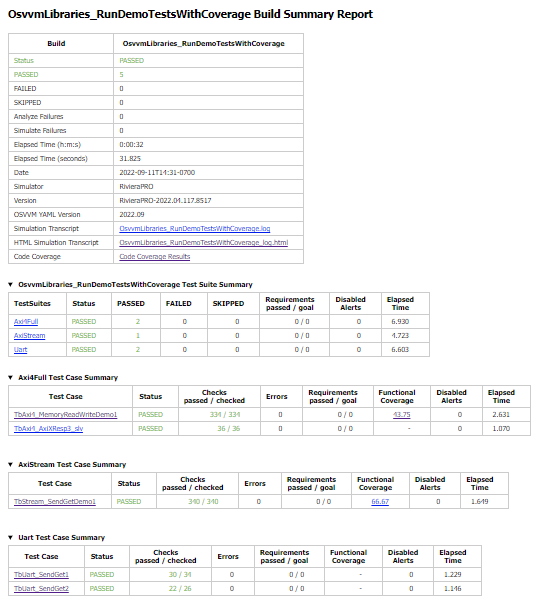
Figure 1: Build Summary Report
Note that any place in the report there is a triangle preceding text, pressing on the triangle will rotate it and either hide or reveal additional information.
Build Status
The Build Status is in a table at the top of the Build Summary Report. It is shown in Figure 2 Build Status. If code coverage is run, there will be a link to the results at the bottom of the Build Summary Report.
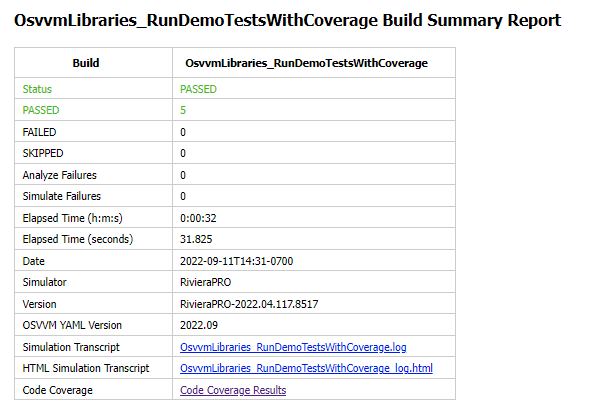
Figure 2: Build Status
Test Suite Summary
When running tests, test cases are grouped into test suites. A build can include multiple test suites. The next table we see in the Build Summary Report is the Test Suite Summary. Figure 3 Test Suite Summary shows that this build includes the test suites Axi4Full, AxiStream, and UART.
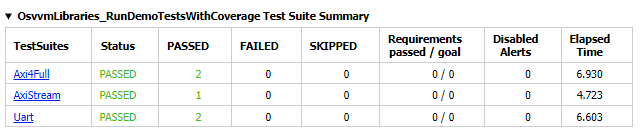
Figure 3: Test Suite Summary
Test Case Summary
The remainder of the Build Summary Report is Test Case Summary. There is a separate Test Case Summary for each test suite in the build. See Figure 4 Test Case Summary.
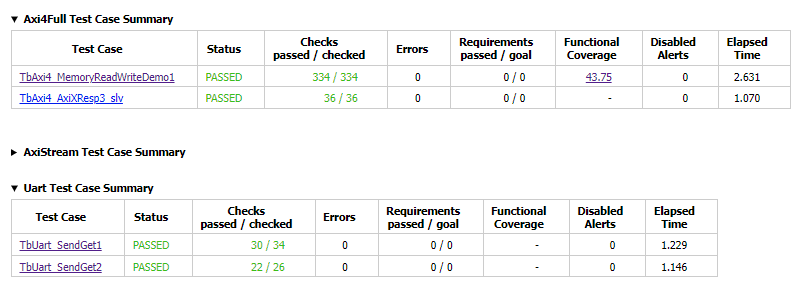
Figure 4: Test Case Summary
JUnit XML Build Summary Report
The JUnit XML Build Summary Report works with continuous integration (CI/CD). The CI/CD tools use this to understand if the test is passing or not. They also have facilities for displaying the report - however, the OSVVM HTML format provides a superset of information.
OSVVM runs regressions on GitHub.
HTML Test Case Detailed Report
For each test case that is run (simulated), a Test Case Detailed Report is produced that contains consists of the following information:
Test Information Link Table
Alert Report
Functional Coverage Report(s)
Scoreboard Report(s)
Link to Test Case Transcript (opened with Transcript Open)
Link to this test case in HTML based simulator transcript
After running one of the regressions, open one of the HTML files in the directory ./reports/<test-suite-name>. See Figure 5 Test Case Detailed Report.
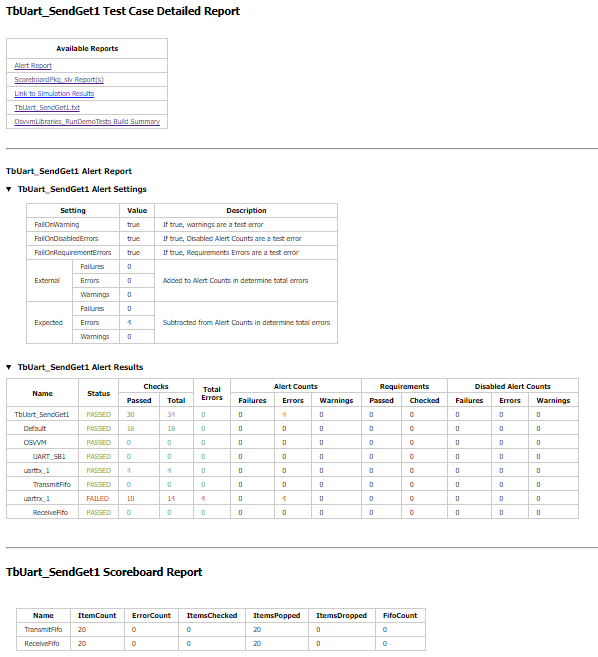
Figure 5: Test Case Detailed Report
Note that any place in the report there is a triangle preceding text, pressing on the triangle will rotate it and either hide or reveal additional information.
Test Information Link Table
The Test Information Link Table is in a table at the top of the Test Case Detailed Report. Figure 6 Test Information Link Table has links to the Alert Report (in this file), Functional Coverage Report (in this file), Scoreboard Reports (in this file), a link to simulation results (if the simulation report is in HTML), and a link to any transcript files opened by OSVVM.
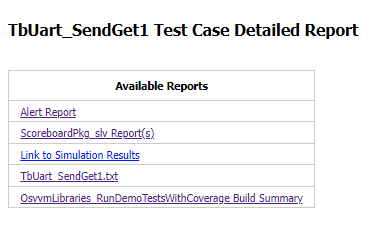
Figure 6: Test Information Link Table
Alert Report
The Alert Report provides detailed information for each AlertLogID that is used in a test case. Note that in the case of expected errors, the errors still show up as FAILED in the Alert Report and are rectified in the total error count. See Figure 7 Alert Report
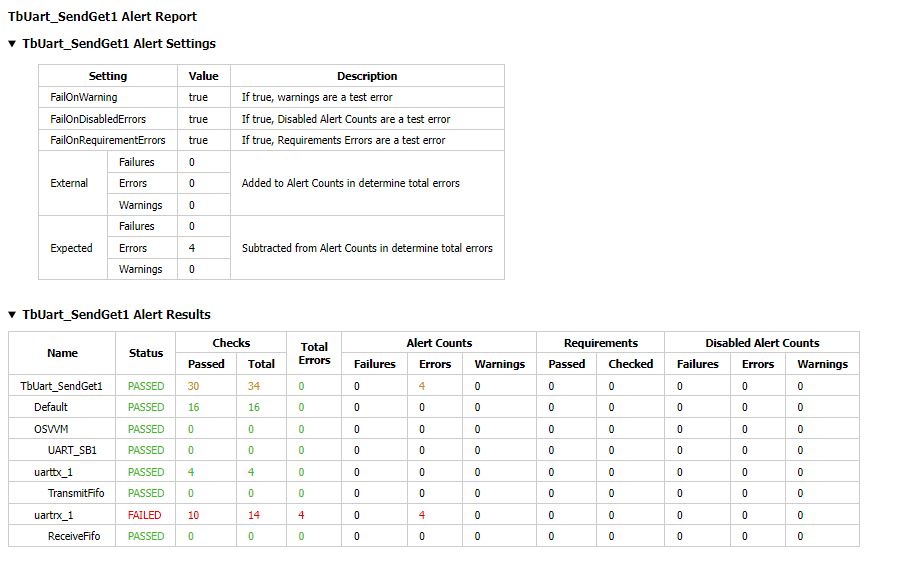
Figure 7: Alert Report
Functional Coverage Report(s)
The Test Case Detailed Report contains a Functional Coverage Report for each functional coverage model used in the test case. See Figure 8 Functional Coverage Report. Note this report is not from the demo.
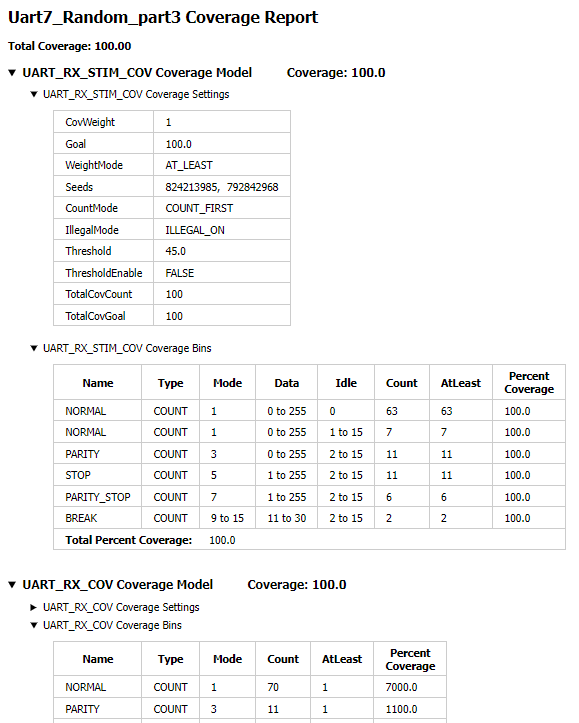
Figure 8: Functional Coverage Report
Scoreboard Report(s)
The Test Case Detailed Report contains a Scoreboard Report, shown in Figure 9 Scoreboard Report There is a row in the table for each scoreboard model used in the test case.
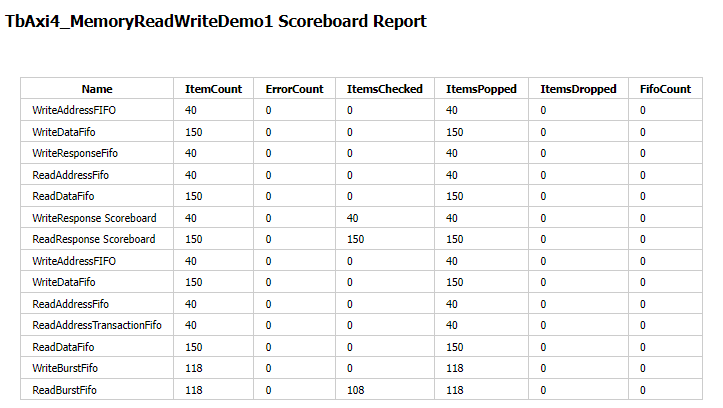
Figure 9: Scoreboard Report
Test Case Transcript
OSVVM’s transcript utility facilitates collecting all test output to into a single file.
Figure 10 shows the Test Case Transcript
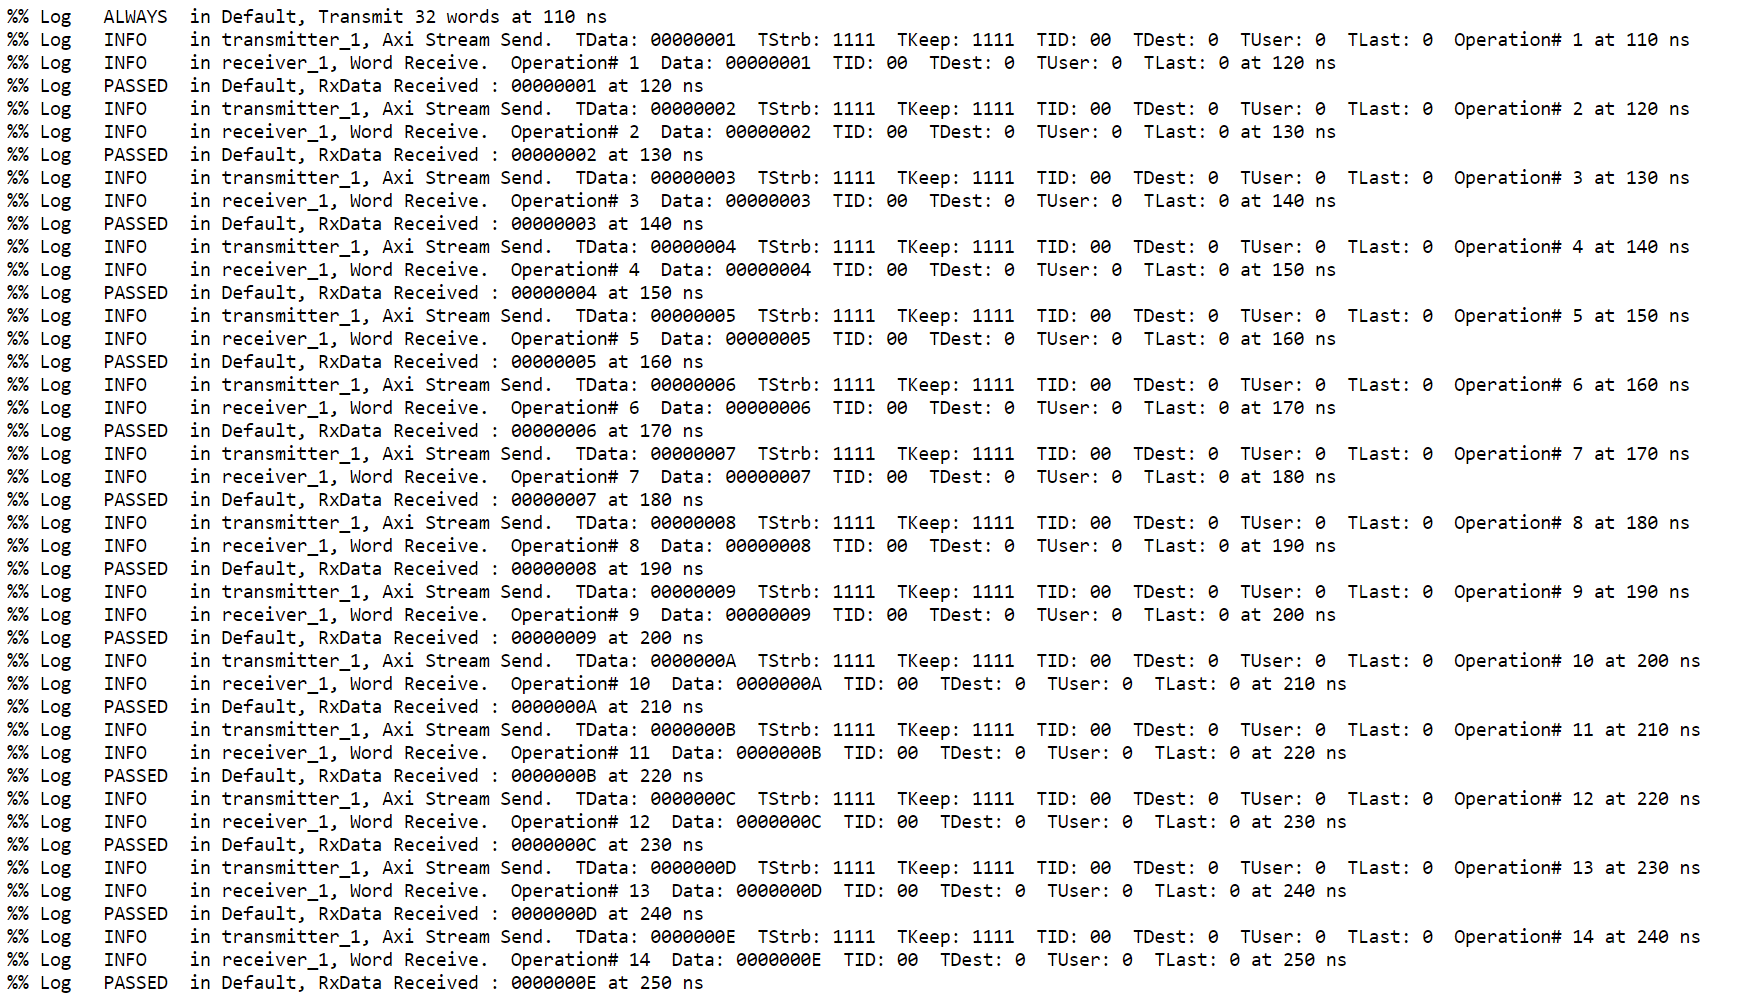
Figure 10: Test Case Transcript
HTML Simulator Transcript
Simulator transcript files can be long. The basic OSVVM regression test (OsvvmLibraries/RunAllTests.pro), produces a log file that is 84K lines long. As a plain text file, this is not browsable, however, when converted to an html file it is. OSVVM gives you the option to create either html (default) or plain text. In the html report, any place there is a triangle preceding text, pressing on the triangle will rotate it and either hide or reveal additional information.
Figure 11 shows the HTML Simulator Transcript
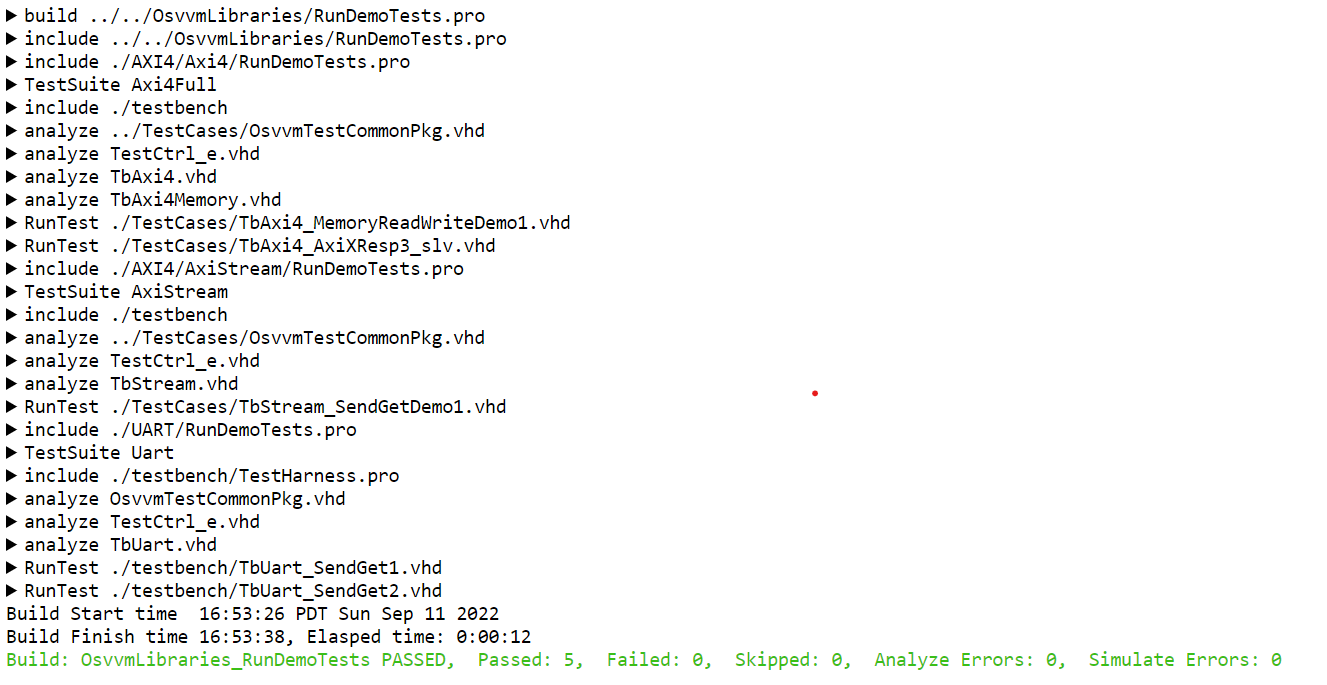
Figure 11: HTML Simulator Transcript